טעקע:Graph of example function.svg
קפיצה לניווט
קפיצה לחיפוש

גודל התצוגה המקדימה הזאת מסוג PNG של קובץ ה־SVG הזה: 600 × 600 פיקצעלן. אנדערע רעזאלוציעס: 240 × 240 פיקצעלן | 480 × 480 פיקצעלן | 768 × 768 פיקצעלן | 1,024 × 1,024 פיקצעלן | 2,048 × 2,048 פיקצעלן.
ארגינעלע טעקע (טעקע SVG, נאמינעל: 600 × 600 פיקסעלן, טעקע גרייס: 18 קילאבייטן)
רעזומע
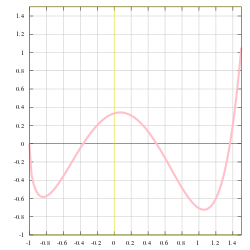
| דעסקריפציע | Graph of for the range |
| דאַטע | |
| מקור | Produced by GNUPLOT 4.2 patchlevel 0 ; then curve replaced by custom smooth fit |
| שרייבער | KSmrq |
| אַנדערע ווערסיעס |
|

![{\displaystyle x\in \left[-1,1.5\right]}](https://wikimedia.org/api/rest_v1/media/math/render/svg/eb217c4b770cdb51b4aaf04a1217e53583041904)

Gnuplot
# Author: Ika, 2013-07-25

set term svg size 600,600 enhanced font 'Times, 12'
set output 'func.svg'

set multiplot

set xrange [-1:1.5]
set yrange [-1:1.5]
set xtics 0.2
set ytics 0.2
set xzeroaxis lt -1 lc rgb "blue" lw 1
set yzeroaxis lt -1 lc rgb "yellow" lw 1

unset label

# Draw the exponential function
set key off

set linestyle 1 lt 2 lc rgb "gray" lw 12
set grid back ls 1.5

plot (4*(x**3)-6*x*x+1)*sqrt(x+1)/(3-x) lc rgb "red" lw 5

unset multiplot
set term x11
set output
ליצענץ:
אני, בעל זכויות היוצרים על היצירה הזאת, מפרסם אותה בזאת תחת הרישיונות הבאים:

|
מען גיט רשות צו קאפירן, פארשפרייטן אדער מאדיפיצירן דעם דאקומענט, לויט די באדינגונגען פונעם גנו פֿרייען דאקומענטאציע ליצענץ, ווערסיע 1.2 אדער א שפעטערע ווערסיע פארעפנטלעכט דורכן פרייע ווייכווארג פונדאציע; מיט קיין אומפארענדערלעכע פאראגראפן, און קיין פאדערשטע אדער הינטערשטע דעק טעקסטן. א קאפיע פונעם ליצענץ איז איינגעשלאסן אינעם אפטייל גנו פֿרייער דאקומענטאציע ליצענץ. |
| די טעקע איז ליצענצירט אונטער דער Creative Commons [Alike 3.0 Unported] ליצענץ. | ||
| ||
| תבנית רישוי זו הוספה לקובץ כחלק מעדכון רישיון GFDL. |
די טעקע ווערט ליצענצירט אונטער דער Creative Commons צושרײַבונג 2.5 אוניווערסאלער ליצענץ.
- איר מעגט:
- באַטייליקן – קאפירן, פֿאַרשפרייטן און איבערשיקן די ווערק
- ווידערמישן – באַאַרבעטן די ווערק
- אונטער די פאלגנדע תנאָים:
- צושרײַבונג – איר מוזט צושרײַבן די ווערק אויפן שטייגער ספעציפֿירט דורכן שאַפֿער אדער ליצענץ־האַלטער (אבער נישט אין אזוינעם אופן אַז עס זעט אויס אַז זיי שטיצן אונטער אײַך אדער אײַער ניץ פון דער ווערק).
איר מעגט אויסקלויבן נארוועלכן ליצענץ.
היסטאריע פֿון דער טעקע
קליקט אויף א דאטע/צײַט צו זען דאס בילד אזוי ווי עס איז דעמאלסט געווען
| דאטע/צײַט | געמינערטע בילד | געמעסטן | באניצער | באמערקונג | |
|---|---|---|---|---|---|
| לויפיק | 12:46, 25 יולי 2013 | | 600 × 600 (18 קילאבייטן) | wikimediacommons>IkamusumeFan | 1. Source code added; 2. Refine axis labels; 3. Grid added. |
טעקע באַניץ
דער פאלגנדער בלאט ניצט די דאזיגע טעקע: